First Global, High Latitude, Plasma Density Measurements made by the Electric Field Experiment on the POLAR Satellite
by M. Johnson and J. Wygant
The first global maps of plasma density at 1 Re altitude in the polar regions of the terrestrial magnetosphere have been made by the electric field experiment on the Polar Satellite through converting spacecraft floating potential measurements to plasma density. A polar plot of the spacecraft floating potential above 50° latitude as a function of magnetic local time, at an altitude of about 4500 miles over the southern polar region, is given in Figure 1. The color scale gives the negative of the spacecraft floating potential, which may be converted to plasma density through the relationships that a spacecraft floating potential of 5 volts corresponds to a plasma density of about 5 cc-1, and 12 volts gives a density of about 1 cc-1.
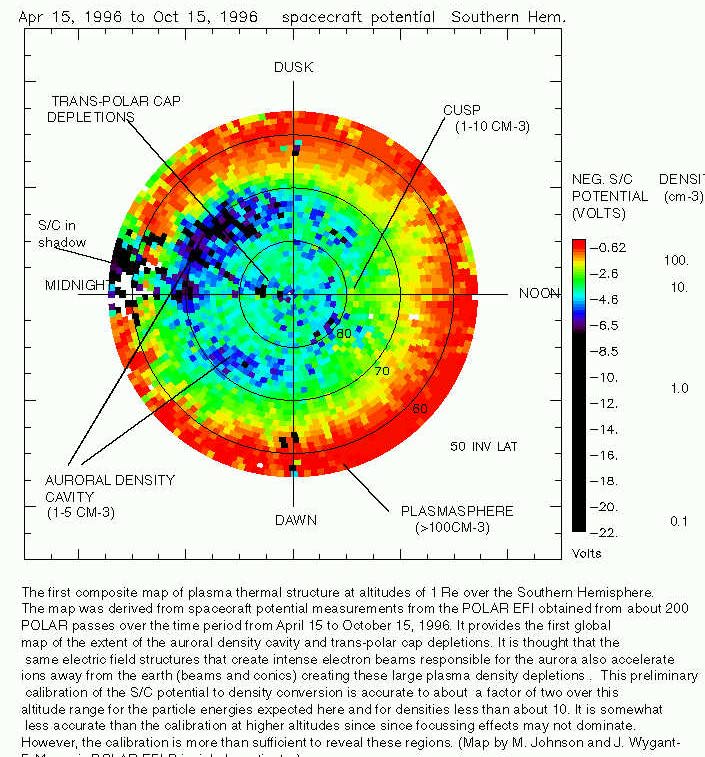
One of the spatial structures revealed by this map is a large density depletion, called the auroral density cavity. It is colored blue and black and is most pronounced in a region centered on 70° on the night side. This is the most common location for auroras, whose precipitating particles are energized by microphysical processes in the auroral acceleration region that involve electrostatic shocks and strong plasma wave structures. These same processes accelerate charged particles upwards to populate the magnetosphere with plasma of ionospheric origin. These acceleration processes result in the excavation of density hole, which has been observed for the first time in its entirety by the Polar Satellite. Another new result from these measurements is that the density cavity is wider and deeper in the pre-midnight sector than it is after midnight. This may be intimately related to the different ways aurora are created in these two regions.
It is important to note that these planetary scale density depletions are very extensive spatially. They extend thousands of kilometers in longitude around the earth, they are hundreds of kilometers wide, and they extend for tens of thousands of kilometers along the magnetic field lines. Yet this depletion is created by micro-scale (100 meters to 1 km) shock like structures which can only be studied with a spacecraft such as Polar that is capable of making high time resolution small scale measurements inside the depletion.
Other features revealed by this map include trans-polar cap depletions which we speculate are associated with polar cap/theta aurora and also the "cusp region" which is associated with the inflow of solar wind particles via the reconnection process along open magnetic field lines. Characteristic densities determined from individual orbits are presented in parenthesis on the map. The calibration of the spacecraft potential is preliminary.
This data was obtained by the Electric Field Instrument on the Polar Satellite. The Principal Investigator for this instrument is Professor Forrest Mozer of the University of California, Berkeley. We would like to thank J. Scudder and C. Keltzing of the Hydra experiment for help in calibration of Spacecraft Potential.