Electric Field Instrument paper
THE ELECTRIC FIELD INSTRUMENT ON THE POLAR SATELLITE
P. Harvey, F.S. Mozer*, D. Pankow, J. Wygant
Space Sciences Laboratory, University of California, Berkeley
*Also at Physics Department, University of California, Berkeley
N.C. Maynard*, H. Singer**, W. Sullivan
Phillips Laboratory, Geophysics Directorate/GPSG, Hanscom Air Force Base
*Now at Mission Research Corporation, One Tara Blvd., Suite 302, Nashua, NH 03062
**Now at NOAA R/E/SE, 325 Broadway, Boulder, CO 80303
P.B. Anderson
Center for Space Physics, Boston University, MA
R. Pfaff, T. Aggson
NASA Goddard Space Flight Center, Greenbelt, MD
A. Pedersen
European Space and Technology Center, Noordwijk, Netherlands
C.-G. Falthammar
Royal Institute of Technology, Stockholm, Sweden
P. Tanskannen
University of Oulu, Oulu, Finland
Abstract
The Polar satellite carries a system of four wire booms in the
spacecraft spin plane and two rigid booms along the spin axis. Each of the
booms has a spherical sensor at its tip along with nearby guard and stub
surfaces whose potentials relative to that of their sphere are controlled by
associated electronics. The potential differences between opposite sphere
pairs are measured to yield the three components of the DC to $>$1 MHz
electric field. Spheres can also be operated in a mode in which their
collected current is measured to give information on the
plasma density and its fluctuations. The scientific studies to be performed
by this experiment as well as the mechanical and electrical properties of
the detector system are described.
Introduction
The Electric Field Instrument (EFI) on the Polar spacecraft measures the three
components of the ambient vector electric field and the thermal electron
density. The results are used to study:
-
Parallel and perpendicular electric fields and density variations in
double layers, electrostatic shocks, and other spatially confined structures
found in the auroral acceleration region and at other locations along the
Polar orbit.
-
The high-latitude convection electric field.
-
The electric field and plasma density structure on field lines connected
to the high-latitude magnetopause, polar cusp, and plasma mantle.
-
Correlations of electric fields with those measured by other ISTP
spacecraft at different points along the same magnetic field line or along a
common boundary, or in different regions of the magnetosphere.
-
Modes, phase velocities, and wavelengths of propagating waves and spatial
structures.
The electric field and plasma density measurements are made over a frequency
range of DC to above 20 kHz. The dynamic range of the electric field
measurement is 0.02 to 1000 mV/m, while the plasma density will be measured at
least over the range of 0.01 to 100 particles per cubic centimeter. A
by-product of the experiment is measurement of the floating potential of the
spacecraft over the range of about +1 to +90 volts. Over this range, the
density varies from less than 0.01 to more than 10 particles per cubic
centimeter.
An important component of the Electric Field Instrument is a two-megabyte
burst memory that allows storage of high-time-resolution field and plasma
density measurements, allowing study of rapid variations of non-linear spatial
structures and waves.
The EFI sensors are arranged as three orthogonal sphere pairs whose
potential differences and Langmuir probe characteristics are measured. As
illustrated in Figure 1, two of these sphere pairs are in the satellite spin
plane on the ends of wire booms that provide tip-to-tip sphere separations
of 100 and 130 meters respectively, while the third pair is aligned along
the spacecraft spin axis with a 13.8 meter tip-to-tip separation that is
provided by rigid stacer booms.
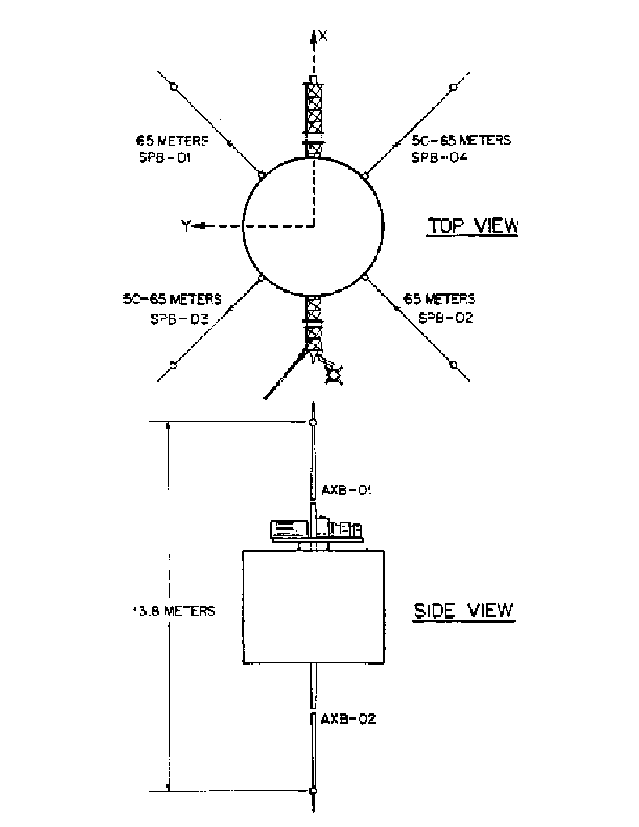 Figure 1. Schematic drawing of the Polar satellite,
illustrating the wire booms.
The electric field preamplifiers have frequency responses to above one MHz
to accommodate their use by the Plasma Wave Instrument. In addition, the
Electric Field Instrument interfaces on the spacecraft with the Magnetic Field
Experiment (which provides information that may be used to trigger bursts of
data collection), and the Hydra and Tide plasma experiments (in order to
coordinate simultaneous high-time-resolution data collection).
The heritage of the Electric Field Instrument encompasses instruments
previously flown on the S3-3, GEOS, ISEE-1, Viking, CRRES, and Freja
satellites, as well as experiments being built for FAST and Cluster.
Table 1 presents a summary of the weight and power consumption of the
components of the Electric Field Instrument on the Polar spacecraft.
TABLE 1
Weight and Power Summary for the Electric Field Instrument
Component  				Weight  	Power
 					(kg)	 	(watts)

Four radial wire boom units & spheres 	15.4 		3.5
Two axial boom units and spheres 	9.2 		2.3
Axial boom stabilizer 			3.4 		0
Main electronics package 	 	7.7 		6.6

TOTAL 					35.7 	 	12.4
Scientific Discussion
Some of the scientific studies that will be performed with data obtained by
the Electric Field Instrument are described below:
Plasma Transport in the Cusp and Plasma Mantle
One of the primary goals of the ISTP program, of which the Polar satellite
is one component, is to clarify the locations and mechanisms of plasma entry
into the magnetosphere. The polar cusp and the high-latitude plasma mantle
are of particular interest in this context. Measurement of the quasi-static
electric field will reveal the plasma flow and transport in these regions, and
show how the transport varies with solar wind conditions. If eddy diffusion
of plasma is an important transport mechanism, this will be seen by
measurement of fluctuations in the transverse electric field.
Altitude Dependence of Large-Scale Transverse Electric Fields
and Observations of Parallel Electric Fields
The distribution of perpendicular electric fields at ionospheric altitudes has
been well established. In the past it has sometimes been assumed that these
fields map along equipotential magnetic field lines to produce the
distribution of electric fields throughout the magnetosphere. The first
direct measurements of high-latitude, magnetospheric electric fields on the
S3-3 satellite dramatically revealed that this mapping assumption is invalid
due to the presence of parallel electric fields in electrostatic shocks and
weak double layers in the auroral acceleration region. Thus, measurements
of large-scale transverse electric fields throughout the magnetosphere are
required in order to understand magnetospheric convection, and direct
observations of parallel electric fields are required to understand the
location and extent of regions of particle acceleration. The mechanisms for
supporting the observed parallel electric fields will be studied by collecting
high-time-resolution data on the microphysics of parallel electric field
regions through use of the on-board burst memory in the Electric Field
Instrument.
Electric Fields of ULF Waves
Measurements of ULF electric fields at low and modest magnetic latitudes
have been made on spacecraft such as ISEE-1 and GEOS. Examples of electric
field fluctuations both with and without accompanying magnetic field
fluctuations have been observed, indicating that both electrostatic and
electromagnetic modes exist at such frequencies. These measurements will be
complemented by wavelength measurements of the same phenomena on Polar and
by extending such observations to the high-altitude, high-latitude region.
Substorm Electric Fields at High Latitudes
Substorms are associated with large, transient, inductive electric fields
which are responsible for many of their features, including enhanced
electric currents, particle precipitation, and plasma injection. At low and
moderate latitudes these fields have been measured by ISEE-1 and GEOS. An
important issue is the character of these fields at high latitude, and
measurements are required on time scales as short as the local ion gyro
period.
Another substorm-related question is the extent of penetration of the
associated electric fields into the plasmasphere. Combined measurements of
electric fields on Polar and Geotail will answer this question.
Fine Structure and Time Variations
Electric field experiments on S3-3, ISEE, and GEOS have seen large electric
fields associated with fine structure in all regions of the magnetosphere,
including the neutral sheet, the high-latitude boundary layer, the
acceleration region, and the bow shock. Many of these structures look like
weak double layers although the time resolution has not been sufficient to
draw definitive conclusions. The Electric Field Instrument on Polar, with its
burst memory, possesses sufficient time resolution to decide this matter and
to explore a new region of space in which instabilities and non-linear
processes may produce similar phenomena.
Modes, Phase Velocities, and Wavelengths of Waves and Spatial Structures
Wavelengths of tens to hundreds of meters may be measured by analyzing the
ratio of the responses of the three electric field antennas of different
lengths. The mode, phase velocity, and wavelengths of electrostatic waves may
be estimated from the ratio of the measured electric fields to the density
fluctuations. The phase velocity of traveling waves and the motions of
spatial structures may be determined by the time delay of their responses on
the different spheres. Lastly, the field components and the plasma density
fluctuations recorded in the on-board burst memory can yield information on
non-linear processes through their auto-correlations, bi-correlations, and
tri-correlations.
High-time-resolution Measurements of Plasma Density
Since both the measured spacecraft floating potential and the measured current
to a voltage-biased sphere depend on the plasma density, relative density
variations on time scales of less than one millisecond or spatial scales of
a few meters will be obtained. This data will be used in the study of density
cavities, spatial turbulence, particle acceleration regions, etc.
Electronic Design
A simplified block diagram of the EFI system electronics is given in Figure 2.
Circuits are contained in each of the six spheres and boom units as well as in
the main electronics package. The major components of this block diagram
will be discussed by following the signal from the sensors to the data
outputs.
 Figure 2. Block diagram of the Electric Field Instrument.
The first electrical interface is between the sensors and the surrounding
space plasma. Each spherical sensor is surrounded by a pair of stubs that are
electrically connected to each other and a pair of guards that are also
connected to each other (see Figure 3). The potentials on the guards and
stubs are offset from their associated sphere potential by values that may
be commanded from the ground. These values are determined from on-board
diagnostic experiments that seek to minimize the flow of photoelectrons
between the sphere and the stubs, guards, and wire that runs from the guard to
the spacecraft (see Figure 3). Typical values of these offset voltages are
less than one volt for the stubs and -3 to -9 volts for the guards. The
stub offset voltage compensates for the difference of the work functions of
the sphere and the stubs, such that the surfaces of the two conductors are
at the same potential and the net photocurrent from one to the other is
zero. The guard potential decelerates and stops photoelectrons that would
otherwise flow from the sphere assembly to the spacecraft or vice-versa.
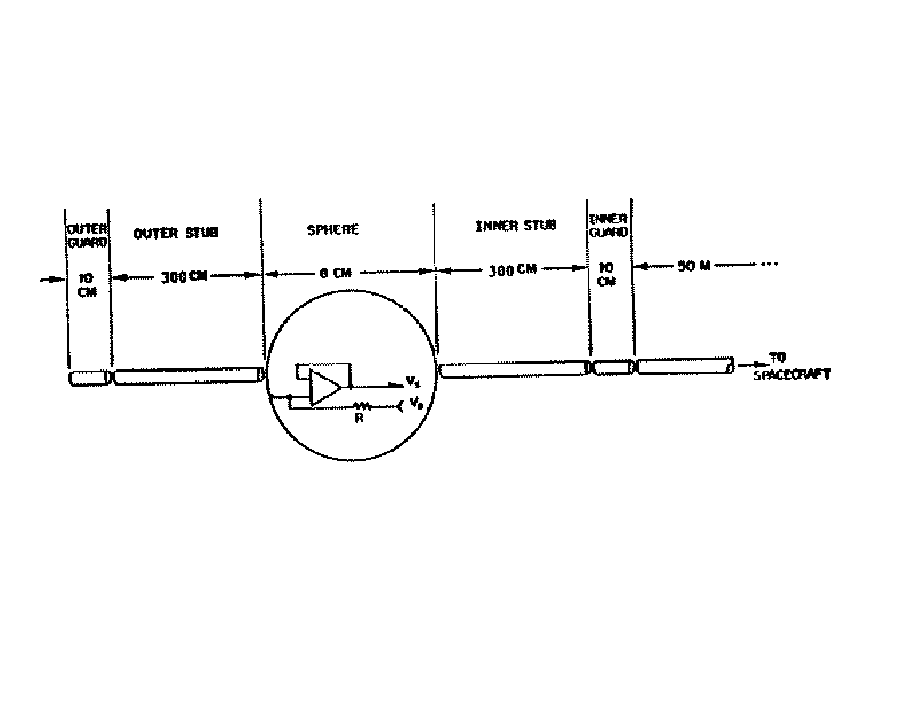 Figure 3. Schematic of the guards and stubs surrounding each sphere.
Block diagrams of the sphere preamplifier in the voltage mode (when the
potential of a current biased sphere is being measured) and the current mode
(when the current to a voltage biased sphere is being measured) are given in
Figures 4 and 5. The stub and guard voltages are illustrated schematically in
these figures as two variable batteries. An additional variable battery
voltage in Figures 4 and 5 serves to current bias the spheres in the voltage
mode and to voltage bias the spheres in the current mode. Since this
voltage is referenced to the sphere output potential in the voltage mode, a
current equal to the variable voltage divided by a fixed resistance is
placed on the spheres in this mode. This current may be varied from about -
500 to +500 nanoamperes by software control. In the current mode, the
variable voltage between -40 and +40 volts appears on the sphere. It may be
stepped while the current to the sphere is measured in order to obtain the
Langmuir probe characteristic of the sphere. The electronics are switched
from one mode to the other by a ground command that activates relays in the
spheres.
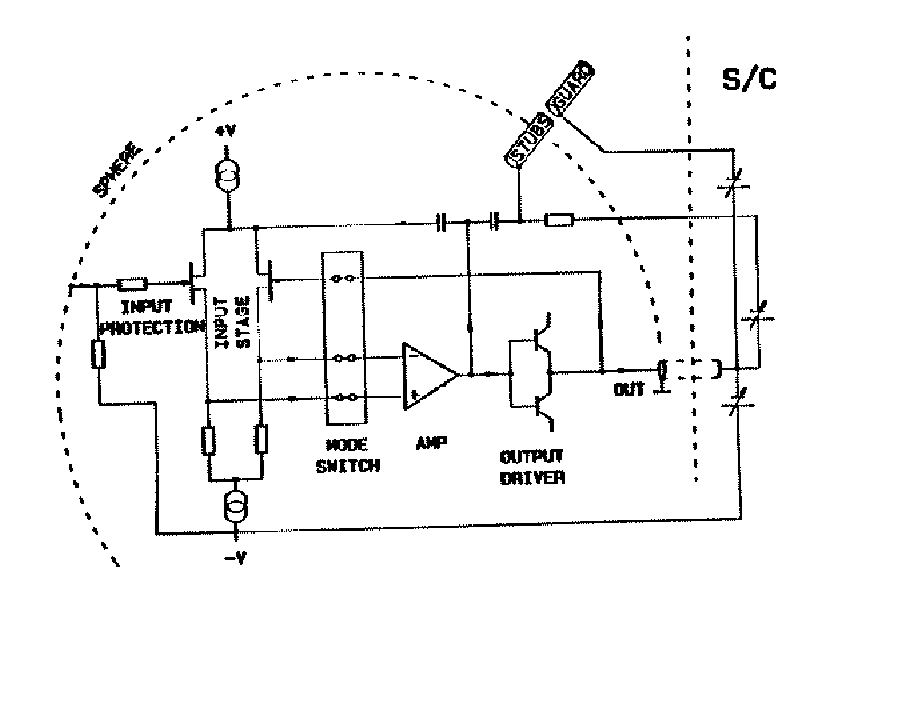 Figure 4. Diagram of the sphere electronics when the
sphere is operated in the voltage mode.
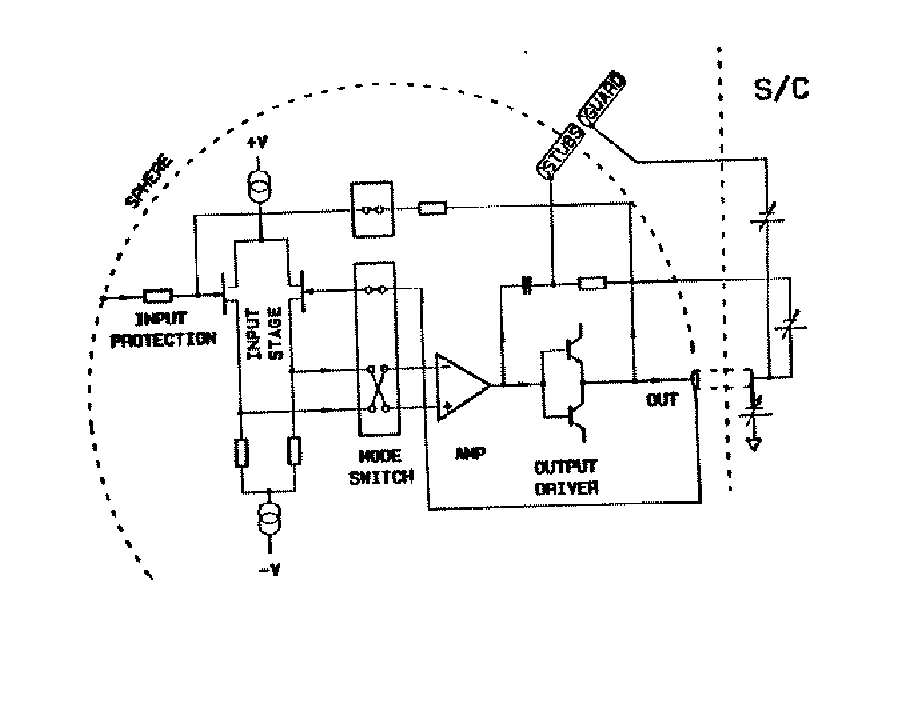 Figure 5. Diagram of the sphere electronics when the
sphere is operated in the current mode.
The 12-volt power supplies that operate the sphere electronics are
referenced to a floating ground that is equal to the low-frequency ($<$1000
Hz) potential of the sphere. Thus, the dynamic range of low-frequency voltage
measurements is equal to the 100-volt range of the floating supply, while
that for higher frequency measurements is the 12-volt power supply rails.
Separate DC-DC converters are provided for each sphere to increase reliability
through redundancy.
The gain versus frequency of the sphere preamplifiers depends on plasma
parameters because the sheath capacitance depends on the Debye length and
the signal in the plasma is attenuated by the ratio of the electronic input
capacitance to the sheath capacitance. For typical conditions, the unity gain
low frequency response decreases by about 3 db above a frequency of about 1 to
10 kHz. Sphere pairs were matched such that the difference in gain between
opposite pairs was typically less than 0.1 db at all frequencies below 700 kHz
and the phase difference of the outputs from opposite spheres was less than
4 degrees. Additional specifications on the sphere preamplifiers are given in
Table 2.
TABLE 2
Specifications on the Sphere Preamplifier
 			Voltage Mode 	 Current Mode

Frequency range 	 0 to 1.25 MHz 	 0 to 3.5 kHz
Gain at DC 		 0 db 	 	 -
Gain at 700 kHz 	-3 db 		 -
Input capacity 	 	 2 pF 		 -
Noise at 20 Hz 	 	500 nV/root Hz 	500 nV/root Hz
DC offset, 70 deg C 	 1.5 mV 	  1.5 mV
Power, no input 	160 mW 		160 mW
Power, full input 	210 mW 		210 mW
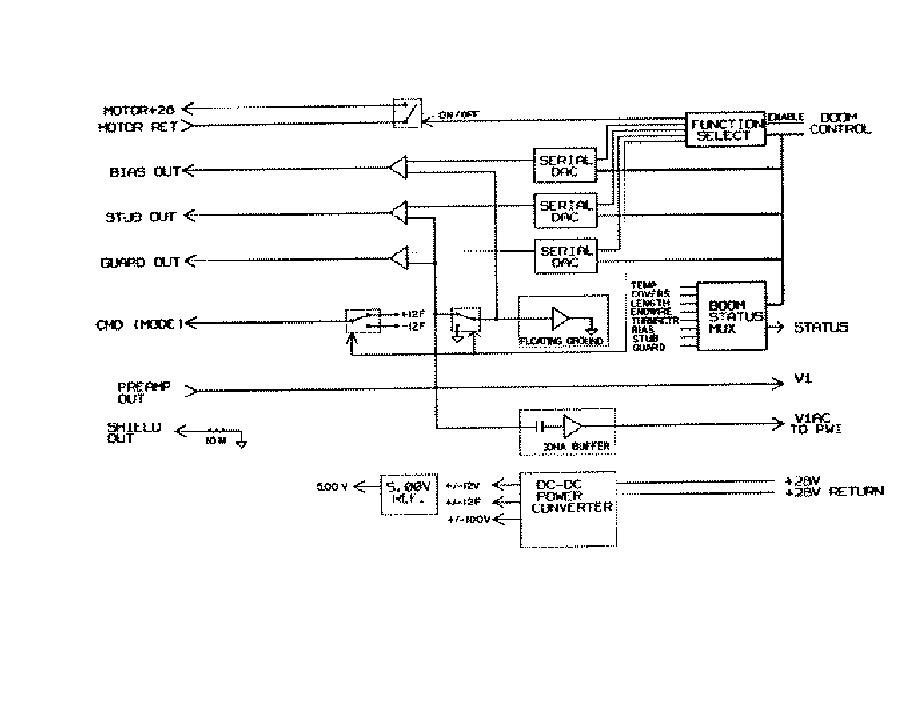 Figure 6. Block diagram of the boom unit electronics.
A block diagram of the remainder of the electronics in each boom unit is given
in Figure 6. The serial DACs receive eight-bit digital inputs from the main
electronics and their analog outputs determine the voltages on the guards
and stubs, and the voltage or current bias. The remainder of the
electronics in the boom units provide the 12- and 100-volt power, interface
the sphere output to the Plasma Wave Instrument, command the sphere
preamplifier into either the current or voltage mode, drive deployment
motors in the radial booms, and provide status information on the boom
operation.
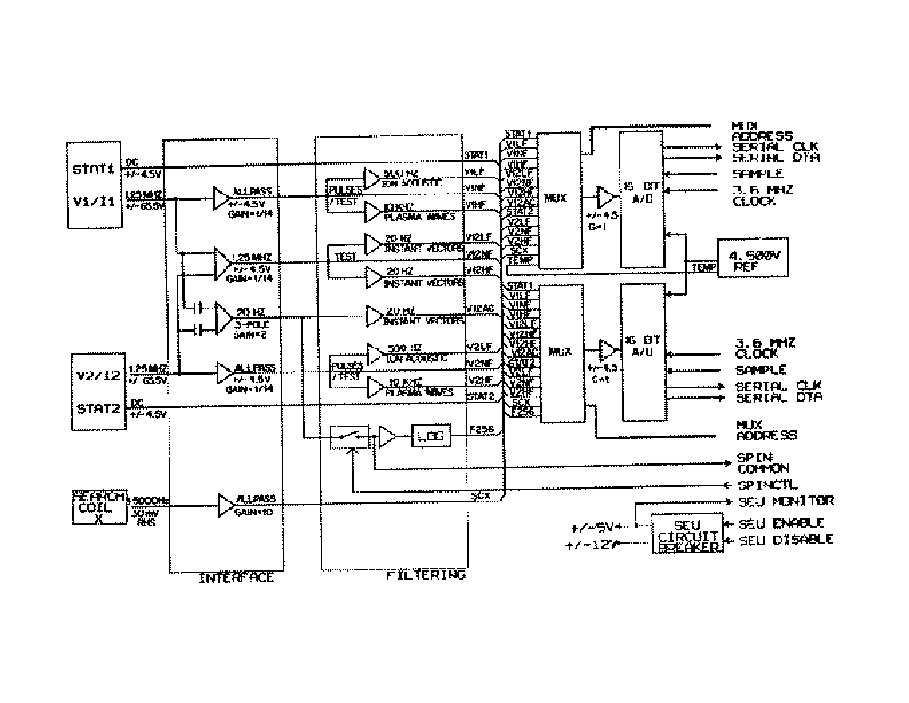 Figure 7. Block diagram of a boom interface electronics board.
As illustrated in Figure 2, the main electronics package contains three boom
interface boards, two CPU boards, and a power supply. A block diagram of a
boom interface board is given in Figure 7. Each boom interface board
accepts analog inputs from one pair of spheres and one component of the search
coil magnetometer provided by the Plasma Wave Instrument. (Since the
interfaces between EFI and the Magnetic Field Experiment, Tide, and Hydra, are
digital, as indicated in Figure 2, they are not part of the boom interface
board.) For each sphere pair, eleven electric field analog outputs are
produced by passing the sphere inputs through filtering and difference
circuits. In the voltage mode, these eleven outputs are:
-
V1LF, V1NF, and V1HF, potential differences between sphere one and the
spacecraft after passage through a low-pass filter at 500 Hz, no filter, and a
low-pass filter at 10 kHz (see Figure 1 for the numbering of the spheres).
-
V2LF, V2NF, and V2HF, potential differences between sphere two and the
spacecraft after passage through low-pass filters at frequencies described
above.
-
V12LF, V12NF, and V12HF, potential differences between sphere one and
sphere two after passage through a low-pass filter at 20 Hz, no filter, and
a low-pass filter at 20 kHz.
-
V12AC, the potential difference between spheres one and two, high-pass
filtered at 20 Hz to eliminate the spin frequency and its harmonics.
-
F256, which is one of three broad-band filter outputs that measure the
amplitude of the potential difference between selected opposing sphere pairs
over broad frequency ranges centered at 32, 256, and 2048 Hz.
For sphere-pairs 3-4 and 5-6, the outputs are as described above except that,
in the current mode, the inputs from spheres three and four are their currents
from the plasma instead of their voltages.
The eleven electric field outputs from each sphere pair and that from the
search coil magnetometer are connected to each of two multiplexers. Any of
these quantities may be selected and digitized to 16-bit accuracy at a
software controlled clock rate less than the maximum rate of 40,000 samples
per second per A/D converter. One converter on each boom interface board
sends its output to the main computer while the other converter sends it
output to the burst computer. Working in tandem, the main and burst computers
are capable of collecting as many as six different quantities, each at
40,000 samples per second, or three different quantities, each at 80,000
samples per second.
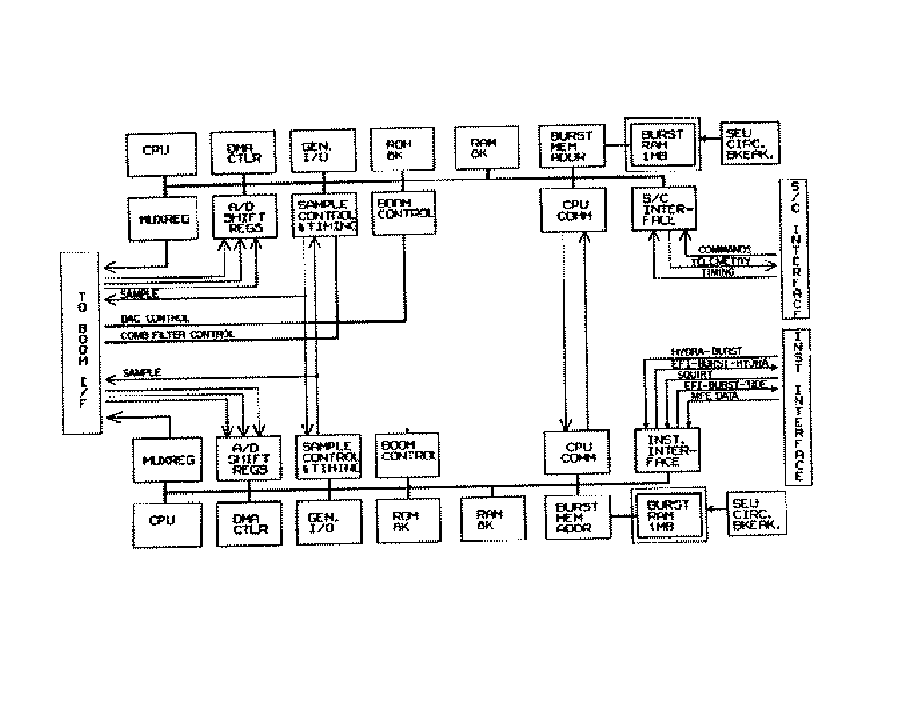 Figure 8. Block diagram of the two CPU electronics boards.
Figure 8 shows a block diagram of the electronics on the two CPU boards. Each
board contains an 80C85 microprocessor, support logic, and a one-megabyte
serially accessed memory for collecting high-time-resolution bursts of data.
In normal operation, one of the two microprocessors receives commands from the
spacecraft, formats telemetry data, and controls the bias, stub and guard
DACs, while the second microprocessor manages the burst collection of data,
threshold determination and event-triggers, and interfaces with the other
Polar instruments.
Software in the microprocessors receives and decodes commands and formats data
for telemetry in table-driven, ground-commanded formats. It also monitors
electric field or magnetic field data to determine when a burst threshold is
exceeded and burst data collection should be saved. One or more possible
criteria for triggering the collection of burst mode data are:
-
One or more filter outputs above a threshold
-
DC magnetic field or its fluctuations above a threshold
-
Trigger received from the Hydra experiment
-
Ground command
The burst memory may be divided into two or more parts and operated in the
following fashion. Each time that a ``bigger'' event is observed, it is
stored in place of the smallest of the previously stored events. In this way,
the ``best'' events of the previous time period are accumulated in burst memory.
Since the parameters of the trigger algorithm are controlled by ground
command, the operation of the trigger will be determined by experience and the
science that is desired. For example, to study Langmuir turbulence, the
highest frequency electric field amplitude might serve as the trigger and each
increase of this amplitude by more than 25% over the threshold for the
previous recording might trigger collection of a new burst. Data from the
burst memory are transmitted to ground by pre-empting part of the normal
telemetry stream for this purpose.
Other functions performed by the flight software are:
-
On-board, sine wave, least-squares fits of potential differences between
opposite sphere pairs, in order to determine electric field components in
the spin plane. These fits are always in the telemetry stream, independent of
the operating mode of the instrument.
-
Bias sweeps. In the voltage mode the bias current to the spheres may be
swept and the resulting data analyzed to determine the optimum bias current,
which is the current that minimizes the sheath impedance. In the current
mode, the voltage on the spheres may be swept in order to measure the Langmuir
probe characteristic and deduce the plasma density and temperature.
-
Deployment. The spin-plane boom deployment sequence is controlled by
the on-board microprocessor which, among other things, temporarily stops the
deployment of one sphere of a pair if its deployed length becomes greater than
that of its mate by more than about 4 centimeters. The axial boom
deployment is accomplished by firing release pyrotechnics through the
spacecraft electronics.
Mechanical Design
The voltages required and produced by the sphere electronics of Figures 4
and 5 are carried along the boom wire by eight conductors that surround a
coaxial signal line. These conductors are covered by successive layers
consisting of a load carrying braid which is made of DuPont kevlar, aluminized
kapton, and an outer braid of silver plated copper, which makes the outer
surface of the boom wire electrically conductive.
The wire boom deployment is performed by a motor which is activated and
controlled by the microprocessor, as discussed above. The spin axis booms are
rigid, pop up, beryllium-copper stacer elements that
separate the on-axis spheres by 13.8 meters. They contain the same
electronics, guard and stub arrangement, and electrical interconnects as do
the wire booms. The on-axis guards and stubs are small stacer elements that
are mechanically connected to a larger stacer that provides the major part
of the deployed length of each boom element.
As part of the on-axis boom system, an axial boom stabilizer is
provided. This is an approximately 1.98 meter tall conical section made of
composite materials, inside of which the axial boom deployment mechanisms
reside.
On-Orbit Operations
Following launch, the wire booms will be deployed over a period of several days
with science stops interspersed for performing diagnostic experiments to
measure spacecraft associated fields as a function of distance from the
spacecraft. Following this deployment, the separation between wire boom pairs
will be 100 meters for one pair and 130 meters for the other. The purposes of
different boom lengths are to verify that the DC signal is proportional to
the boom length and to obtain wavelength information on short wavelength modes
from the different response of the two antennas. Approximately a year
following launch, the shorter antennas may be deployed to their full 130
meters tip-to-tip length.
Additional on-orbit decisions will be made on which spheres are
operated in the current mode and how often they are operated in this way.
The nominal plan is to operate spheres 3 and 4 (on the shorter wire booms)
in the current mode approximately 25-50% of the time and to operate the
remaining spheres in the voltage mode only.
Acknowledgements.
This work was performed under NASA contract NAS5-30367.
 Figure 1. Schematic drawing of the Polar satellite,
illustrating the wire booms.
 Figure 1. Schematic drawing of the Polar satellite,
illustrating the wire booms.
 Figure 2. Block diagram of the Electric Field Instrument.
 Figure 3. Schematic of the guards and stubs surrounding each sphere.
 Figure 4. Diagram of the sphere electronics when the
sphere is operated in the voltage mode.
 Figure 5. Diagram of the sphere electronics when the
sphere is operated in the current mode.
 Figure 6. Block diagram of the boom unit electronics.
 Figure 7. Block diagram of a boom interface electronics board.
 Figure 8. Block diagram of the two CPU electronics boards.