psbl_ poynt_flux_submitdoc 8:00 am as submitted 3/17/99 to ref.
Polar Comparisons of Intense Electric Fields and Poynting Flux Near and Within the Plasmasheet-Tail Lobe Boundary to UVI Images: An Energy Source for the Aurora
J. R. Wygant, A. Keiling, C. A. Cattell, and M. Johnson, R. L. Lysak, School of Physics and Astronomy, University of Minnesota, Minneapolis, MN
M. Temerin, F. S. Mozer, Space Sciences Laboratory, University of California, Berkeley, CA
C. A. Kletzing, J. D. Scudder, Department of Physics and Astronomy, University of Iowa, IA
W.Peterson, Lockheed-Martin Palo Alto Laboratories, Palo Alto, CA
C. T. Russell, IGPP, University of California, Los Angeles, CA
G. Parks, M. Brittnacher, Geophysics Program, University of Washington
AbstractIn this paper, we present measurements from two passes of the Polar spacecraft of intense electric and magnetic field structures at and within the outer boundary of the plasmasheet at geocentric distances of 4-6 Re near local midnight. The electric field variations have maximum values exceeding 100 mV/m and are typically polarized approximately normal to the plasmasheet boundary. The electric field structures investigated vary over time scales (in the spacecraft frame) ranging from 1 to 30 seconds. They are associated with strong magnetic field fluctuations with amplitudes of 10-40 nT which lie in the plane of the plasmasheet and are perpendicular to the local magnetic field. The Poynting flux associated with the perturbation fields measured at these altitudes is about 1-2 ergs/cm2s and is directed along the average magnetic field direction towards the ionosphere. If the measured Poynting flux is mapped to ionospheric altitudes along converging magnetic field lines, the resulting energy flux range up to 100 ergs/cm2s. These structures occur during periods when the POLAR spacecraft is magnetically conjugate (to within a one degree mapping accuracy) to intense auroral structures as detected by the POLAR UVI Imager. The electron energy flux (averaged over a spatial resolution of 0.5 degrees) deposited in the ionosphere due to auroral electron beams as estimated from the intensity in the UVI LBH-long filters is 20-30 ergs/cm2s. Thus, there is strong evidence that these electric field structures provide sufficient Poynting flux to power the acceleration of auroral electrons (as well as the energization of up-flowing ions and Joule heating of the ionosphere). During some events, the phasing and ratio of the transverse electric and magnetic field variations are consistent with earthward propagation of Alfven surface waves with phase velocities of 4000-10000 km. During other events, the phasing of electric and magnetic fields suggests interference between upward and downward propagating Alfven waves. The E/B ratios are about an order of magnitude larger than those expected for typical values of the height integrated conductivity of the ionosphere.
1. IntroductionThe University of California at Berkeley Electric Field Instrument on the Polar spacecraft provides the opportunity to explore the structure and dynamics of the electric field at the plasma sheet boundary at 4-6 Re geocentric distance . This region is located on magnetic field lines at altitudes between the auroral acceleration region at distances of 1.5-3 Re and the more distant portions of the geomagnetic tail where energy conversion processes associated with reconnection occur. A number of lower altitude spacecraft including S3-3 (Mozer et al., 1977; 1980; Temerin et al., 1982), Viking (Block and Falthammar, 1990 ), DE-1 (Weimer and Gurnett, 1993; Reiff et al., 1993), Fast (Carlson et al, 1998, Ergun et al., 1998; McFadden et al., 1998), and Polar (Mozer et al., 1998) have explored geocentric distances between 1.5 and 3.5 Re on auroral field lines. These spacecraft have established that this is the region where steady state and transient electric fields parallel to the magnetic field accelerate auroral electron beams both into the ionosphere and also away from the Earth into the magnetosphere. One unresolved question in understanding the dynamics of the magnetosphere and creation of the aurora is "What are the processes at higher altitudes in the geomagnetic tail which provide the power for the auroral acceleration particle and how is that power transferred to the acceleration region?" This problem may be understood within the context of the Poynting theorem:

where E is the electric field, B is the magnetic
field, and J is the electric current density,
![]() is the power dissipated per unit volume in the
energization of particles, K is the kinetic energy density of the
particles, and FE is the kinetic energy flux. The relevant fields
which are used to calculate the Poynting flux are the perturbation
electric ((E) and magnetic ((B) fields. In both cases, we have
subtracted background fields from the measured fields to determine the
perturbation fields. In the context of this paper, these perturbation
fields may be due to small scale steady state electric field
structures associated with field aligned currents which close at lower
altitudes. Alternatively, they may be associated with time variable
Alfvenic structures. In either of these cases, in the MHD limit, the
Poynting flux is directed along the background magnetic field. In the
absence of any buildup of electromagnetic or particle energy density
between 1 and 6 Re on auroral field lines, we have
is the power dissipated per unit volume in the
energization of particles, K is the kinetic energy density of the
particles, and FE is the kinetic energy flux. The relevant fields
which are used to calculate the Poynting flux are the perturbation
electric ((E) and magnetic ((B) fields. In both cases, we have
subtracted background fields from the measured fields to determine the
perturbation fields. In the context of this paper, these perturbation
fields may be due to small scale steady state electric field
structures associated with field aligned currents which close at lower
altitudes. Alternatively, they may be associated with time variable
Alfvenic structures. In either of these cases, in the MHD limit, the
Poynting flux is directed along the background magnetic field. In the
absence of any buildup of electromagnetic or particle energy density
between 1 and 6 Re on auroral field lines, we have

where the surface integral of the Poynting flux into a volume equals the surface integral of the kinetic energy flux out of the volume. The geometry of the surface integral is illustrated in Figure 1 which defines the surface of integration as a field aligned surface which encloses a flux tube and two endcaps at 1 Re and 5 Re. In the absence of energy conversion (J(E = 0), and neglecting any perpendicular Poynting flux flowing out of the flux tube, the Poynting flux flowing into the region at 6 Re must equal the Poynting flux flowing out of the region at 1 Re. Since the cross sectional areas of the end caps at 1 Re and 6 Re are inversely proportional to the background magnetic field strength, the Poynting flux scales proportionally with the magnetic field strength. In the presence of auroral particle acceleration, J(E > 0 and a fraction of the incident Poynting flux is converted to particle energy flux. At small perpendicular wavelengths, electron inertial and kinetic effects give rise to a wave parallel electric field. In addition, parallel electric fields can arise due to nonlinear plasma effects such as double layers. Parallel electric fields can give rise to a small component of the wave Poynting flux directed perpendicular to the ambient magnetic field. This perpendicular component of the Poynting flux can direct energy into an inverted V structure where it is dissipated through particle acceleration (Mozer et al., 1980). We note that Figure 1 only illustrates the scenario for production of earthward electron beams and out-flowing ions. In general (as is the case in our examples), electrons can be accelerated upwards and ions downward. In addition, the figure, for simplicity, depicts the Poynting flux as associated with a time variable Alfven wave, but the Poynting flux could be associated with a steady state electric field structure with pairs of upward and downward field aligned currents producing the magnetic field perturbation (as illustrated in Mozer et al., 1980).
The weakest electron beams which can produce auroral emissions at the visual detection threshold have energy fluxes of ~ 1 erg/cm2s at ionospheric altitudes. However, much stronger auroral beams have been observed. A recent statistical survey shows that the earthward energy flux in auroral electron beams in the pre-midnight local time sector at ionospheric altitudes exceeds 60 ergs/cm2s during 10% of spacecraft passes (Evans, 1998, unpublished manuscript) with maximum values up to 500 ergs/cm2s. The latitudinal scale size of intense energy flux was ~ 0.6 degrees or less for 80% of Evans' events. Recent comparisons of FAST electron data at altitudes of 4000 km and airborne imagers showed that the difference in energy flux between the down going beams and upward secondary electrons peaked at magnitudes of about 25 ergs/cm2s when discrete auroral arcs occurred on conjugate magnetic field lines (Stenbaek-Nielsen et al., 1998). In addition, there is a lesser contribution to energy flux associated with ion beams and ion conics streaming away from the auroral acceleration region. These ion populations are energized in the auroral acceleration region by parallel electric fields (in the case of beams) and by transverse wave heating (in the case of conics). Outflowing ions are associated with energy fluxes on the order of 0.1 to 1 erg/cm2s (Ghielmetti et al., 1979) or less than 1% of that found in the electron beams. Thus, most of the particle energy flux generated in the auroral acceleration region resides in electron beams. Over the large spatial scales encompassing the entire auroral zone, the energy flux dissipated in Joule heating of the conductive ionosphere due to the large spatial scale convection electric field and large scale current systems is roughly 1-5 ergs/cm2s at ionospheric altitudes. On much smaller spatial scales, the Freja spacecraft below 1800 km altitude, has observed Poynting flux values of 1-10 ergs/cm2s (Louarn et al., 1994) over spatial scales of about 1 km in association with kinetic Alfven waves. There have been estimates of Poynting flux of 0.1 ergs to 4 ergs/cm2s at altitudes of 8000 km (Nagatsuma et al., 1996). These lower altitude observations consisted of roughly equal energy fluxes propagating towards and away from the earth. Measurements of electron energy flux and Poynting flux using Triad spacecraft data at altitudes of 400-1000 km, show that the Poynting flux ranged up to 6 ergs/cm2s over spatial scales of several degrees of invariant latitude (Kelley, et al., 1991). Since these observations were obtained below the altitude of the auroral electron acceleration region, the measured Poynting flux provides an estimate of the energy flux dissipated in Joule heating of the ionosphere. Similar values of Poynting flux have been observed during sounding rocket flights above sun-aligned polar cap arcs (Kletzing et al., 1996). The Poynting flux dissipated in the ionosphere may be regarded as the portion escaping through the lower "end cap" in Figure 1.
It should be noted that an important limitation of this study is that it is not possible to directly determine the surface integral of the Poynting flux at high altitudes since we do not know the velocity of the plasma sheet boundary past the spacecraft and can not convert time domain data in the spacecraft frame to data which are a function of spatial coordinates. Thus the spatial scales of Poynting flux observed at high altitudes can not be determined and compared to the low altitude latitudinal width of the electron energy flux in auroral beams. Similarly, the question of whether the structures observed herein are spatial structures or temporal structures awaits subsequent detailed analysis.
In summary, conservation of energy strongly suggests there should be processes operating above the auroral acceleration region which generate earthward directed Poynting flux which when mapped along magnetic field lines to ionospheric altitudes can reach values of 50 ergs/cm2s (or more) a significant fraction of the time. The actual Poynting flux measured at lower altitudes should be less since it is dissipated (primarily through the energization of auroral electrons) as it propagates towards the earth. The Poynting flux should be strongly amplified in proportion to the magnetic field strength as it approaches the earth, S1=S2 (B1/B2) . At altitudes of 4-5 Re near the plasma sheet boundary, the magnitude of the magnetic field is about 125 times less than at ionospheric altitudes. Therefore, a Poynting flux of about 0.5 ergs/cm2s at 4-5 Re above the auroral zone would account for strong auroral electron beams with energy fluxes of 50 ergs/cm2s at ionospheric altitudes. To our knowledge, there has never been a published estimate of the values of Poynting flux directed towards the earth at the outer boundary of the plasmasheet at altitudes above the auroral acceleration region.
In this paper, we describe the first observations of intense electric and magnetic field fluctuations near the outer boundary of the plasmasheet and provide estimates of the resulting large values of Poynting flux flowing along magnetic field lines towards the ionosphere. These in-situ data are compared to simultaneously UVI images of the aurora conjugate to the spacecraft position and the inferred energy flux associated with the electron beams. These observations are obtained from two passes of Polar near local midnight on May 1, 1997 and May 9, 1997. These events were chosen from the 20-30 most intense plasmasheet electric field structures obtained during the ~400 plasmasheet crossings of 1997 (Keiling et al, 1999, unpublished manuscript).
II. Instrumentation
The electric field measurements on the Polar spacecraft are obtained from the U. C. Berkeley electric field instrument (Harvey et al., 1995). The electric field is determined through measurement of the electric potential difference between pairs of current-biased spherical sensors. These sensors are deployed at the ends of three orthogonal pairs of booms with tip to tip separations 100 m and 160 m (in the spin plane) and 13.8 m (along the spin axis). The three dimensional electric field vector is sampled at 20 samples/s. The magnetic field vector is sampled at 8.3 samples/s by the UCLA three dimensional fluxgate magnetometer (Russell et al., 1995). The Hydra particle detector (Scudder et al., 1995) provides measurements of electron density and temperature and electron and ion particle and energy flux with a 13.8 second time resolution. Images from the Ultraviolet Imager (Torr et al., 1995) provide information on the spatial location of intense aurora and also an estimate of the energy flux of auroral electrons which caused the aurora. This instrument cycles through different filters in order to provide spectral information on the aurora. In this study, images were obtained using a filter centered on 1700 Angstroms with a band width of about 80 Angstroms which responds to molecular N2 Lyman Birge Hopfield (LBH)-long wavelength emissions. These emissions are primarily due to electron impact excitation. This filter has been designed and calibrated to provide information on the total energy flux deposited by auroral electrons in the ionosphere and is accurate to about 50 % (Germany et al. 1998). The image has a spatial resolution of about 0.5 degrees which is primarily due to a wobble in the spacecraft spin axis.
III. Plasmasheet pass on 5/9/1997
Figure 2 presents 6 second average electric and magnetic field data and 13.8 second average plasma measurements on May 9, 1997 during an inbound pass from the tail lobe to the plasma sheet near 22 MLT. The geomagnetic activity during the hour encompassing this crossing was AE (preliminary) ~100 nT to 150 nT . Figure 2 encompasses the time interval from 5:30 UT to 6:10 UT while the spacecraft moved from L=9.4 to 4.8. The top panel of Figure 2 shows the z GSE component of the electric field (northward and perpendicular to the ecliptic plane). The second panel displays the y component of the magnetic field with a Tsyganenko model magnetic field subtracted. This component is directed eastward in an azimuthal direction. The third panel displays the Poynting flux along the ambient average magnetic field. This component of the Poynting flux has been calculated from the three components of the perturbation electric field and three components of the perturbation magnetic field. These perturbation fields were calculated by detrending each component of the field by subtracting a 180 second running average from the original data. The projection of the Poynting flux along the measured total magnetic field vector averaged over 180 seconds. The fourth panel shows the sum of the electron and ion energy flux along the magnetic field (positive is along the magnetic field) calculated from the Hydra measurements. The fifth panel shows the electron density. The bottom two panels present color coded energy-time spectrograms of ion and electron energy fluxes. The vertical brackets in the top panel delineate time periods when the foot of the spacecraft magnetic field line mapped to within one degree of the regions of intense ( >16 ergs/cm2s) auroral emission determined from the UVI images in Figure 3.
The particle data show that Polar entered the plasma sheet boundary layer from the lobe at 5:37 UT at a geocentric distance of about 4.9 Re. The entry into the plasmasheet is most clearly indicated by the order of magnitude increases in the 2-20 keV electrons . The electric field enhancements are located on the high density side of a jump in density from about 0.1 cm-3 on the lobe side to 0.4 cm-3 on the plasmasheet side.
The electric field data shows is a series of three fluctuations ranging between -100 mV/m and 140 mV/m. The full width at half maximum of the center fluctuation is about 20 seconds. Cumulatively the three fluctuations last for about 300 seconds. This five minute time interval coincides with the passage of the spacecraft through an upward current sheet as indicated by a shift in the dc level of By. Superimposed on this shift are three ~20 nT fluctuations in the magnetic field. These transverse magnetic field fluctuations are similar in wave form to those in the normal component of the electric field. The total magnitude of the magnetic field (not presented) has fluctuations on the order of 1 nT over similar time scales during these waves. Thus the transverse variations in the magnetic field strongly dominate over the compressional variations.
The dominant component of the Poynting flux is earthward and along the magnetic field. The Poynting flux calculation indicates that the intense electric field spikes are associated with 0.6 to 1 ergs/cm2s of electromagnetic energy flux towards the earth. Very little reflected energy flux (away from the earth) is observed. The scale on the right side of the plot which presents the Poynting flux as mapped to ionospheric altitudes, shows the Poynting flux at 100 km altitude ranges between 24 and 100 ergs/cm2s. This mapped Poynting flux is much larger than the Poynting flux previously measured in situ at lower altitudes in (or below) the auroral acceleration region. As previously discussed, this suggests that the energy flux is being dissipated through particle acceleration before it reaches the ionosphere.
Figure 2a presents electron and ion energy flux as a function of energy for pitch angles between 0 and 30 degrees, 75 and 105 degrees, and 150 to 180 degrees. The data shows that the electric field structures and earthward Poynting flux coincide with 1-10 keV up-going ions which have presumably been accelerated below in the acceleration regions. These ions are labeled "UFO" in the bottom panel. A more detailed analysis of the data indicates that these ions are almost completely field aligned. Notice the flux of the up-flowing ions mirroring off the Southern hemisphere is much smaller. Deeper into the plasmasheet, the data shows a sequence of nested signatures of 2 to >20 keV energy dispersed ions (labeled "Dis. Ion" in the bottom panel) bouncing between opposite hemispheres. The existence of these ions indicates the magnetic field lines on which they are observed are closed. The existence of velocity dispersed ions is one signature of the central plasmasheet. There is evidence for field aligned electron beams traveling both towards and away from the Northern hemisphere's ionosphere. The electron beams may be found in the first and third panels of Figure 2a and are labeled "E.B.". These beams are further evidence that Polar is on field lines associated with auroral acceleration. Up-flowing electrons are a common observation in downward current regions in the auroral acceleration region. An alternative explanation of the electrons moving towards the earth from the more distant tail is that they are accelerated at the reconnection line in the plasma. These field aligned fluxes delineate the outer boundary of the plasmasheet as defined by Williams, et al, (1981), Eastman et al., (1984), and, most recently at these altitudes, using POLAR data, Kletzing et al., (1997),
The measurements of the particle energy flux show that the entire plasma sheet is associated with earthward energy flux with an average value of about 0.3 ergs/cm2s and peaking near the outer edge of the plasmasheet at values of 0.8 ergs/cm2s. Although only the total energy flux is plotted in Figure 2, the electron contribution dominates over the ion by 1-2 orders of magnitude. The particle flux dominates over Poynting flux everywhere but at the outer edge of the plasmasheet, where both the Poynting and particle fluxes increase.
The correlated electric and magnetic field spikes in Figure 2 are consistent with the propagation of incident and reflected Alfven surface waves or pulses along the magnetic field as we shall show below. The surface "waves" are confined to a thin layer along the plasma sheet boundary near the plasmasheet tail lobe density jump. The ratio (Ez/(By~ 4000 to 10000 km/s calculated from the peak values of the fields coincides with a reasonable estimate of the Alfven speed in this region. Since the wave has a duration of about 15 seconds, the wavelength along the magnetic field of the wave in this scenario is about 10 Re to 25 Re. This distance is at least a factor of two to five larger than the distance to the ionosphere. Thus, it is likely that both incident and reflected waves should be observed along with the associated interference effects.
Figure 3 presents an expanded view of about 8 minutes of data from Figure 2 encompassing the interval of strong electric fields. This figure includes measurements of Poynting flux, Ez and By at a 0.5 second time resolution. There is phase lag between the electric and magnetic field signals with the electric field spikes maximizing on the leading edge of the magnetic field signals. This is consistent with interference between the incident and reflected pulse. A wave which has reflected off a conducting ionosphere has a reversed tangential electric field component and a magnetic field component in the same direction. Thus, after the reflected wave arrives at the spacecraft, there is destructive interference between the electric field pulses and constructive interference for the magnetic field pulses. It is interesting to note that despite the existence of the reflected wave, the Poynting flux shows that the total energy flow is strongly earthward.
The strong electric and magnetic fluctuations result in a layer of strong energy flow which begins at the plasmasheet density jump and continues for about 150 s as the spacecraft moves deeper into the plasmasheet. A rigorous determination of the width of the layer awaits the appropriately instrumented multispacecraft missions in this region of space. However, the following indirect arguments provide a rough estimate of the over all spatial scale for the layer containing the three Poynting flux enhancements assuming it is time stationary but moving in the frame of the spacecraft. The width of the region 1 current system in the pre-midnight sector is typically about 3 degrees in invariant latitude or ~ 300 km at 100 km altitude. Using a dipole mapping, (which should be accurate for these altitudes) the field-aligned current structure maps to a spatial scale about 10 times as wide or about 3000 km at the altitude of the spacecraft. Thus, the region associated with the dc shift in By, identified as the high altitude mapping of the Region 1 current structure, should have a width of about 3000 km. It lasts for about 300 seconds so the plasma sheet boundary must be moving past the spacecraft at about 10 km/s (which is much larger than the velocity of the spacecraft). If the electric field structures are time stationary in the frame of the plasmasheet and simply carried over the spacecraft by the motion of the plasmasheet, the spatial scale in the direction normal to the plasmasheet of the individual electric field spikes is about 100 kms and the corresponding electric potential drop normal is about 5-10 kilovolts. If mapped back down to ionospheric altitudes these electric field structures have a latitudinal spatial scale of about 10 km which is comparable to the dimensions and the perpendicular potential drops of the low altitude large amplitude (~ 0.5 to 1 V/m) electric field structures responsible for discrete auroral arcs. It should be emphasized, the structure may not be steady state and, under those circumstances, these illustrative estimates would not be valid.
UVI Images during plasmasheet crossing on 5/9/97
Figure 4 presents a sequence of eight UVI images using the LBH-long filters taken during a 10 minute interval encompassing the strong electric fields of Figure 2. The images start at 5:35 UT and ending at 5:44:31 UT. The time of each image is displayed in the upper left hand corner above each image. Images using the LBH-long filters are interwoven images using other filters (not shown) and are obtained at time intervals alternating between 19 seconds and 165 seconds. The images are color coded in photon flux and in energy flux.
The images show that throughout this ten minute period there was an auroral arc centered at ~69 degrees invariant latitude at ~ 21:30 MLT. The region of strongest emission is red with a white center. The scale indicates that these intensities are typically associated with an energy flux of auroral electrons ranging from 20 ergs/cm2s to above 27 ergs/cm2s. The arc is nearly constant in intensity and position over this time interval, however a close inspection indicates that it is moving slightly westward and northward and is slowly fading in intensity over the time interval of the pass. The mapped foot of the Polar magnetic field line is denoted by a small (faint) cross. The estimated accuracy of this mapping is about 1 degree. The spacecraft remains in the vicinity (~ 1 degree) of the brightest region over a period of 5-10 minutes. It is clear that the large amplitude electric fields and the associated strong Poynting flux are observed on this pass only during time periods when the spacecraft is magnetically conjugate to the brightest auroral emission features. During such times, the electric fields and Poynting flux vary on time and spatial scales which can not be resolved by the images. The peak values of the Poynting flux range up to factors of 3 larger than the estimated energy flux due to precipitating electrons as estimated by the imager. The mapped Poynting flux is about 100 ergs/cm2s while the energy flux associated with the region of bright auroral emission is typically 20 ergs/cm2s in the region conjugate to the spacecraft position. As previously discussed, the incident Poynting flux must account for the energy flux of precipitating electrons but also for significant contributions from ionospheric Joule heating, and lesser contributions from ion acceleration. In addition, the spatial/temporal scales over which the Poynting flux varies are much smaller than those resolved by the images. The images average over ionospheric spatial scales of about 0.5 degrees. This is much larger than the 0.1 to 50 km spatial scales of discrete auroral arcs. In addition, an inspection of low altitude FAST data shows that the latitudinal extent of localized electric fields may be an order of magnitude smaller than the latitudinal extent of the electron beams (Ergun et. al., 1998). Under these circumstances, the peak value of the Poynting flux measured by the higher resolution satellite measurements should be an order of magnitude larger than the value of the electron energy flux inferred from the averaged images. Nevertheless, the comparison of the Poynting flux measurements at high altitude to the UVI images suggests that the Poynting flux is being converted to particle energy in the acceleration region- probably by the several hundred mV/m to one V/m localized electric field structures first observed by the S3-3 spacecraft over twenty years ago and now resolved routinely by the Polar and FAST spacecraft.
IV. Plasmasheet crossing on 5/1/1997
In contrast to the 5/9/97 event, the pass of 5/1/97, shown in Figure 5, occurs when the aurora were highly variable and magnetic activity was much stronger than the previous event (Kp=5+, AE=1000 to 1500 nT). The data in Figure 5 is presented in the same format as Figure 2 with the same time resolution and averaging. The first encounter with the plasmasheet occurred about one half hour prior to the beginning of Figure 5. The beginning of Figure 5 coincides with an interval when >1 keV ions and electron fluxes were strongly diminished. At about 20:25 UT, the Polar spacecraft encountered enhanced electron and ion fluxes over energies between 1 and 10 keV. These flux increases were coincident with a >50 nT decrease in By. This is consistent with presence of plasmasheet fluxes and an encounter with the region 1 current system. Superimposed on this dc shift, are fluctuations in By over periods of roughly five minutes. These fluctuations suggest slow temporal and or spatial variations in the large scale field-aligned current system. The electric field fluctuations also increase from very small values in the tail lobes (< 1 mV/m) to about 5 mV/m in concert with this entry into the plasmasheet. The enhanced fluctuation level suggests observations of the high altitude mapping of turbulent auroral electric fields. Within this region of electric field turbulence, there are brief intervals of very strong localized electric fields ranging in amplitude between 10 and 80 mV/m. Notice, unlike the 5/9/97 event, there is no associated density jump. We focus on a brief episode of electric fields at about 20:28 UT with a peak value of about -80 mV/m. This interval is associated with an enhancement in the Poynting flux ranging between 0.3 and 1 erg/cm2s along the magnetic field and towards the earth. When mapped to the ionosphere, this Poynting flux supplies peak energy fluxes of about 38-125 ergs/cm2s averaged over the six second time resolution of the data. In this pass, as in the pass on May 9, the Poynting flux associated with what appears to be slowly varying magnetic field variations indicative of large scale quasi-steady state field aligned currents is much smaller in amplitude than the Poynting flux associated with variations on faster spatial/temporal scales.
Figure 6 presents 0.5 second time resolution data over the time interval from 20:26:40 UT to 20:30:00 UT encompassing the large Poynting flux and spiky electric and magnetic fields observations of the previous figure. The data reveal a sequence of electric field spikes with time durations of 1-3 seconds and amplitudes up to 200 mV/m. The electric field spikes are in phase (with no discernible time lag) with magnetic spikes of about 30 nT. The E/B ratio is in the range of 3000-7000 km/s. An inspection of the full vector measurements (not included here) shows that the electric fields are nearly normal to the plasmasheet boundary. The magnetic field spikes lie in the plane of the plasmasheet boundary and perpendicular to the local magnetic field. The perturbations in the magnitude of the total magnetic field is on the order of three nT or less indicating the spikes are largely incompressible fluctuations. The magnitude of the Poynting flux along the magnetic field has been calculated and is ~ 3.8 ergs/cm-3 for the largest spike. This value of the Poynting flux mapped to ionosphere would be about 400 ergs/cm2s. The lower two panels of Figure 6 present a time averaged version the data presented in the upper two panels which reveals that there are quasi-monochromatic waves with periods of about 20 seconds present throughout the interval of intense ~1 second Alfven spikes. The large value of E/B, its similarity to estimates of the Alfven velocity (based on the measured density and magnetic field magnitude), and the orientation of the electric and magnetic field vectors suggest that the structures are propagating Alfvenic waves. There is a close timing relation between the occurrence of the ~1 second spikes and the phase of the lower frequency wave. The spikes re-occur with a similar periodicity as the period of the low frequency wave and appear to "grow out of the wave". This suggests a non-linear interaction between the two signals.
Figure 7 presents a sequence of UVI images which indicate that, in contrast to the May 9, 1997 data, the aurora is strongly structured in both space and time. There are two latitudinally confined bands of strong emissions, one centered at about 70 degrees and another at about 62 degrees. The mapped position of the spacecraft slowly moves southward from 69 to 67 degrees invariant latitude at about 23:30 MLT. Over the period of the first six images from 20:21 UT to 20:28 UT, there is a strong enhancement in the spatial extent and intensity of the emission in the latitudinally confined auroral structure near the spacecraft conjugate point. The energy flux of auroral electrons within 1 degree of the spacecraft conjugate point increases by about a factor of 5 from about 5 ergs/cm2s to >25 ergs/cm2s. A close inspection of the sequence of UV images shows that near the spacecraft foot point there are a number of intervals of auroral intensifications and fading throughout the period from 20:21 UT to 20:34 UT. The strongest intensification near the foot of the spacecraft magnetic field line occurs between 20:27:46 and 20:28:06. The localized regions which are colored "white" in the image exceed 27 ergs/cm2s which is the saturation level of the color coded scale. An inspection of images with a higher value for the saturation of the color scale shows that this region of intense auroral emission was associated with an energy deposition rate of 40-50 ergs/cm2s. This corresponds to the interval of the strongest Poynting flux at the position of the spacecraft. It also corresponds to the interval of ~1 second Alfvenic spikes with intervals of Poynting flux values up to 500 ergs/cm2s.
We emphasize (as the principle experimental result of this paper) that during this pass (as was the case during the 5/9/97 pass), the intervals of strong earthward Poynting flux at Polar altitudes occur when the spacecraft is magnetically conjugate to regions of strong auroral energy flux as estimated by the UVI images. The Poynting flux varies on spatial and/or temporal scales much smaller than the UVI images can resolve. The region of intense Poynting flux occurs over only a fraction of the extent of the plasmasheet.
V. Summary
Electric and magnetic field data and particle fluxes, observed at 4-6 Re altitude above the auroral acceleration region, were used to characterize the properties of very large amplitude electric fields and associated Poynting flux in the outer boundary of the plasmasheet. It should be emphasized that the electric field spikes are obtained from a data set of about 25 plasmasheet crossing containing the largest electric field structures seen in one years of Polar plasmasheet crossings (about 400 orbits). These electric fields are polarized predominantly perpendicular to the nominal plasma sheet boundary and reach amplitudes >100 mV/m. The associated magnetic field perturbations lie in the plane of the plasmasheet and are orthogonal to the local magnetic field. Individual fluctuations have durations between 1 second and 30 seconds. In the examples we have presented, the region of strong fluctuations lasts for one to several minutes. Comparison to particle measurements indicate the fields are typically located at/or within the plasma sheet boundary layer as defined by the presence of field-aligned ions and outward flowing electron beams. The intense fields are confined to a fraction (~1/3) of the total spatial extent of the plasmasheet boundary layer. Within this sub-layer of strong electric fields, there is smaller scale structure which may be either temporal or spatial. In some cases (Figures 5 and 6) the simplest interpretation is that the structures are propagating Alfvenic spikes with phase velocities of 4000 to 10,000 km/s, durations of ~ 1 second, and wavelengths of about 1 Re. In other cases (Figure 2a), the ratio of the electric to magnetic fields is consistent with Alfvenic structure, but the phasing of electric and magnetic field variations suggests a superposition of pulses which are incident on and reflected from the ionosphere. Analysis of the relation of electric and magnetic field structures could be complicated by the existence electron beams accelerated at low altitudes by parallel electric fields which develop as part of the dissipation of Poynting flux energy. These beams would produce magnetic field aligned currents flowing up and down magnetic field lines. and the associated magnetic field perturbations which could be superimposed on purely wave signatures.
The electric fields are compared to simultaneous images from the Polar UVI imager. Images obtained using the LBH-long filters provide an estimate of the auroral energy flux due to electron beams incident on the ionosphere (Germany et al., 1998 and references therein). This paper demonstrates, for the first time, that there are very strong Poynting fluxes associated with the observed large amplitude electric fields which can provide the energy for the low altitude auroral electron beams. The Poynting flux is field aligned and predominately earthward. Peak values exceeded 1 erg/cm2s during one pass and 3.5 ergs/cm2s on the other. Mapped to ionospheric altitudes, these values correspond to energy fluxes of 100-400 ergs/cm2s and are sufficient to explain the energization of some of the strongest electron beams ever presented in the literature. As expected from the structure of the electric fields, the Poynting flux is often confined to spatially localized layers in the plasmasheet boundary layer. The Poynting flux flowing in these small scale structures is 1-2 orders of magnitude more intense than the Poynting flux due to the large scale field-aligned currents and the associated large scale electric fields. The Poynting flux is enhanced when the Polar spacecraft is magnetically conjugate to within 1 degree of auroral structures and is much smaller elsewhere. The Poynting flux is much more structured than the temporal and spatial variations seen in the auroral images. This may be attributed to the fact that the UVI images average over larger spatial regions (~ 1/2 degree due to a spacecraft wobble) than the in-situ measurements. The difference in resolution of the Polar fields experiments and the UVI imager may be an explanation for the fact that the Poynting flux mapped to the ionosphere is sometimes a factor of four or more larger than the energy flux associated with electron beams as inferred from UVI images. Other explanations include larger Joule heating than typically invoked and the possibility that the latitudinal width of the electron beam is larger than the latitudinal width of the Poynting flux in flow region.
There is additional evidence from the Polar spacecraft that the high altitude electric fields in the boundary of the plasmasheet a necessary condition for driving auroral acceleration. A comparison of in-situ measurements and UVI images, shows that when the auroral structures in the night side auroral oval were weak, the peak values of localized electric fields and Poynting flux during passes through the night side plasmasheet were smaller by factors of 5-10. Furthermore, a statistical analysis using 24 months of Polar data shows that the spatial distribution of high altitude, large amplitude electric fields (>20 mV/m) delineates the average boundary of the auroral oval (Keiling et al., 1998) in a manner similar to the distribution of electrostatic shocks observed by S3-3 at ~1 Re altitude in the auroral acceleration region (Bennett et al., 1983). Magnetic field lines converge by a factor by of 10 between the altitudes of high altitude Polar events and the auroral acceleration region at 1 Re altitude. This implies that the electric field structures described herein should have similar magnitudes to the 0.2 to 1 V/m nominal magnitudes of intense localized electric field structures seen at 1 Re altitude by S3-3 if they are mapped as steady state structures along equipotential magnetic field lines. Other dynamically significant intense electric field structures near the outer boundary of the plasmasheet have been observed in the Polar EFI data set. Electric field spikes with durations and amplitudes of several hundred mV/m and ranging down to the time resolution of the instrument (1/10 second) are almost always observed in conjunction with many of the longer duration spikes presented herein (Keiling et al, 1998). Since the magnetic field instrument data has a resolution of about 8.3 samples/s, we can not determine if these short duration spikes have magnetic field components. Over much shorter time durations, using data from the EFI burst memory in this same region of space, Cattell et al., 1998, have presented observations of intense solitary waves with electric field components along the magnetic field ranging > 100 mV/m and lasting for 0.1 ms.
The plasmasheet boundary layer is often singled out as a region of strong ion flows and significant energy transfer. To our knowledge, the Poynting flux contribution to the total energy flux has never been measured in this region. Although a detailed comparison of the PSBL in situ particle energy flux and Poynting flux awaits a more detailed analysis, the results presented herein indicate near the outer edge of the plasmasheet, the Poynting flux strongly dominates over the energy flux associated with field-aligned ions and is comparable or larger than to the energy flux associated with the electrons. Since particles are magnetically mirrored as they approach the earth, only those particles in the loss cone can reach low altitudes. Thus, for an isotropic distribution the increase in particle flux due to the convergence of magnetic field lines exactly cancels magnetic mirroring and the energy flux along the magnetic field line is constant. The total energy flux due to particles will be somewhat larger than that estimated from an isotropic distribution because the electrons have a field aligned anisotropy. In addition, the existence of a parallel electric field in the auroral acceleration region may widen the loss cone. However, the above arguments do indicate that the observed Poynting at this altitude regime can provide an important contribution to the energy transfer between the plasmasheet and the ionosphere especially in the vicinity of auroral arcs. The fact that the particle flux maximizes at the times when the Poynting flux is maximum suggests the possibility that some portion of the in-situ electron energy flux at 4-5 Re has been created at higher altitude through acceleration mechanisms powered by Poynting flux.
Acknowledgments. Analysis of electric field data was supported by NASA International Solar Terrestrial Program (NASA contract NAG 5-3182).. Work at the University of Washington was supported by NASA grant NAG 5-3170. Analysis of magnetometer data was supported by NASA ISTP grant 5-3217. Work at Lockheed-Martin Palo Alto Research Lab (WKP) was supported by contract # NAS5-30302. Work at the University of Iowa in analysis of HYDRA data was performed under NASA grant number NAG 5 2231 and DARA grant 50 OC 8911 0. The results of the HYDRA investigation were made possible by the decade-long hardware efforts of groups led at NASA GSFC by K. Ogilvie, at UNH by R. Torbert, at MPAe by A. Korth and UCSD by W. Fillius. We would also like to thank Reiner Friedel and co-workers for use of the PAPCO graphical display program.
References
Bennett, E.C. et al, The distribution of auroral electrostatic shocks below 8000-km altitude, J. Geophys. Res., 88, 7107, 1983
Block, L.P., and C.-G. Falthammer, The role of magnetic-field-aligned electric fields in auroral acceleration, J. Geophys. Res., 95, 5877-5888, 1990
Carlson C. W., R. F. Pfaff, and J. G.Watzin, The Fast Auroral Snapshot (FAST) mission, Geophys. Res. Lett., 25, 2013, 1998.
Cattell, C.A., Comparisons of Polar satellite observations of solitary wave velocities in the plasmasheet boundary layer and the high altitude cup to the auroral zone, Geophys. Res. Lett., 26, 425, 1999
Eastman, T.E., L.A. Frank, W.K. Peterson, and W. Lennartsson, The Plasma Sheet Boundary Layer, J. Geophys. Res, Vol. 89, No. A3, 1553, 1984
Ergun R. E. et al., Fast satellite observations of electric field structures in the auroral zone, Geophys. Res. Lett., 25, 2025, 1998
Evans D.S. A study of intense auroral electron precipitation events, unpublished manuscript 1998
Germany G. A. et al., Auroral observations from the POLAR Ultraviolet Imager (UVI), in Results from International Solar Terrestrial Physics Program, Geophysical Monograph, American Geophysical Union 108, 1998
Ghielmetti, A. G., et al., Downward flowing ions and evidence for injection of ionospheric ions into the plasmasheet, J. Geophys. Res., 84, 156, 1979
Harvey P., and F.S. Mozer, D. Pankow, J. Wygant, N.C.Maynard, H.Singer, W. Sullivan, P.B. Anderson, A. Pedersen, C.-G. Falthammar, and P. Tanskannen, The Electric Field Instrument on the Polar Satellite in The Global Geospace Mission, edited by C.T. Russell, Kluwer Academic Publishers, 1995, reprinted from Space Sciences Rev., 71, N1-4, 1995
Keiling et al., Intense electric fields at the plasmasheet boundary, to be submitted, J. Geophys Res, 1999
Kelley, M.C., D. J. Knudsen, J.F. Vickery, Poynting flux measurements on a satellite: A diagnostic tool for space research, J. of Geophys. Res., Vol. 96, 201-207, 1991
Kletzing, C., G. Berg, M. C Kelley, F. Primdahl, and R. B. Torbert, The electrical and percipitation characteristics of morning sector sun-aligned auroral arc, J. of Geophys. Res, Vol. 101, 17175, 1996
Louarn, E., et al, Observation of kinetic Alfven waves by the FREJA spacecraft, Geophys. Res. Lett., v21, 17, 1847, 1994
Lyons, L.R., Discrete auroral and magnetotail processes in Auroral Physics, edited by C.-I. Meng, M.J. Rycroft, and L. A. Frank, 195-205, Cambridge University Press, New York, 1991
Lysak, R.L., Electrodynamic coupling of the magnetosphere and ionosphere, Space Science Rev., 33, 1990
Lysak, R.L., The relationship between electrostatic shocks and kinetic Alfven waves, Geophys. Res. Lett., 25, 2089, 1998
McFadden, J.P. et. al., Spatial structure and gradients of ion beams observed by FAST, Geophys. Res. Lett., 25, 2021, 1998.
Mozer, F.S., et al, Observations of paired electrostatic shocks in the polar magnetosphere, Phys. Rev. Lett., 38, 292-295, 1977
Mozer, F.S., et al, Satellite measurements and theories of low altitude auroral particle acceleration, Space Sci Rev, 27, 155-213, 1980
Mozer, F.S. et. al., New features of time domain electric field structures in the auroral acceleration region, Phys Rev Lett., 79, 1281, 1997.
Nagatsuma, T. et al, Field-aligned currents associated with Alfven waves in the poleward boundary region of the nightside auroral oval, J. Geophys. Res, 1996
Reiff, P.H., et al, On the high- and low-altitude limits of the auroral electric field region in Auroral Plasma Dynamics, Geophysical Monograph 80, Ed. R.L. Lysak, AGU, 143, 1993
Russell, C.T. and R.C. Snare, J.D. Means, D. Pierce, D. Dearborn, M. Larson, G. Barr, and G. LE, The GGS/Polar Magnetic Fields Investigation, in The Global Geospace Mission, edited by C. T. Russell, Kluwer Academic Publishers, 1995, reprinted from Space Sciences Rev., 71, N1-4, 1995
Stenbaeck-Nielsen, H.C. et al., Aircraft observations conjugate to FAST: Auroral arc thickness, Geophys. Res. Lett., 25, 2073, 1998
Scudder J., F. Hunsacker. G. Miller, J. Lobell. T. Zawistowski, K. Ogilvie, J. Keller, D. Chornay, F. Herrero, R. Fitzenreiter, D. Fairfield, J. Needell, D. Bodet, J. Googins, C. Kletzing, R. Torbert, J. Vandiver, R. Bentley, W. Fillius, C. McIlwain, E. Whipple, and A. Korth, Hydra- A 3-dimensional electron and ion hot plasma instrument for the Polar spacecraft of the GGS mission, in The Global Geospace Mission, edited by C. T. Russell, Kluwer Academic Publishers, 1995
Torr M.R., D.G. Torr, M. Zurik, R.B. Johnson, J. Ajello, P. Banks, K. Clark, K. Cole, C. Keffer, G. Parks, B. Tsururanti, and J. Spann, A Far Ultraviolet Imager for the International Solar Terrestrial Physics Mission. in The Global Geospace Mission, edited by C.T. Russell, Kluwer Acadenic Publishers, 1995
Weimer, D.R., and D.A. Gurnett, Large-amplitude auroral electric fields measured with DE 1, J. Geophys. Res, 98, 13557, 1993
Williams, D. J., Energetic ion beams at the edge of the plasmasheet: ISEE observations plus a simple explanatory model, J. Geophys. Res., 86, 5502, 2982
Zelenyi, L. M., R.A. Kovrazkhin, and J.M. Bosqued, Velocity dispersed ion beams in the night side auroral zone:AUREOL 3 observations, J. Geophys. Res., 95, 12119, 1990
Figures
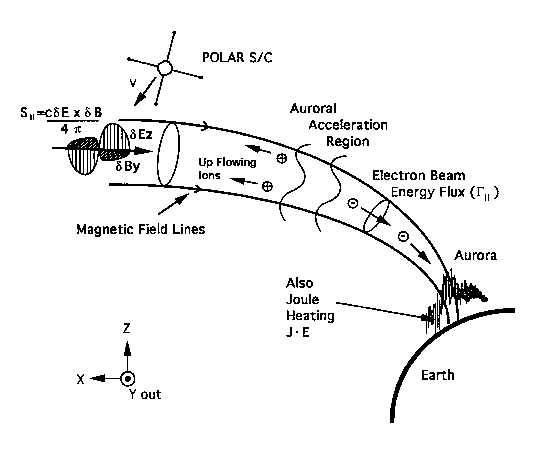
Figure 1 Illustration of a magnetic flux tube conjugate to the auroral acceleration region with incident Poynting flux and its conversion to energized particles and joule heating of the ionosphere
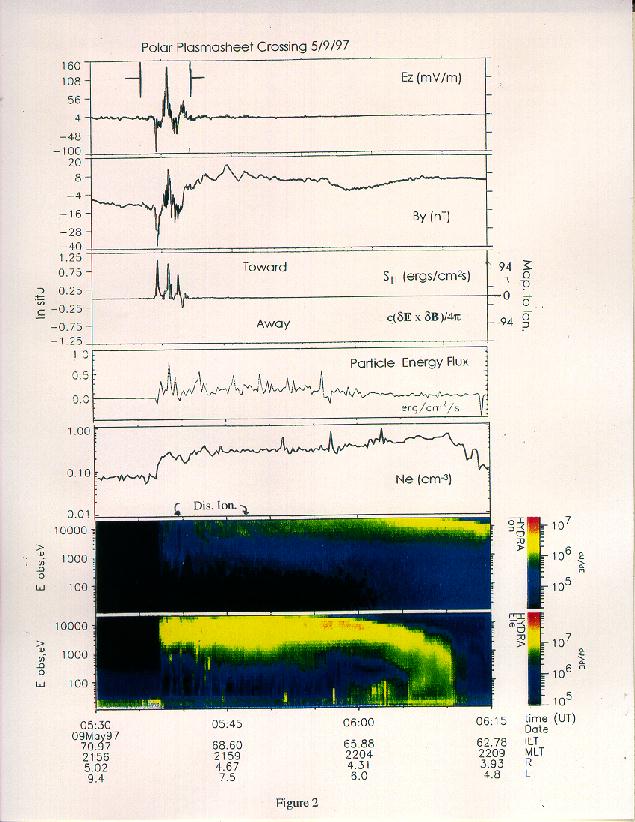
Figure 2. Measurements from POLAR crossing of the PSBL on 5/9/1997.. The panels show (from top to bottom) the electron density, the component of electric field approximately normal to the plane of the plasmasheet, the magnetic field (model subtracted) perpendicular to the local magnetic field in the plane of the plasmasheet and the Poynting flux component along the magnetic field. The fourth panel is the total particle energy flux along the magnetic field with positive values corresponding to earthward flux. The fifth panel is the electron density obtained from the Hydra measurements. The two lower two panels display Hydra energy flux-time spectrograms of electrons and ions.

Figure 2a. Hydra electron and ion energy fluxes sorted into pitch angle bins for 5/9/1997.
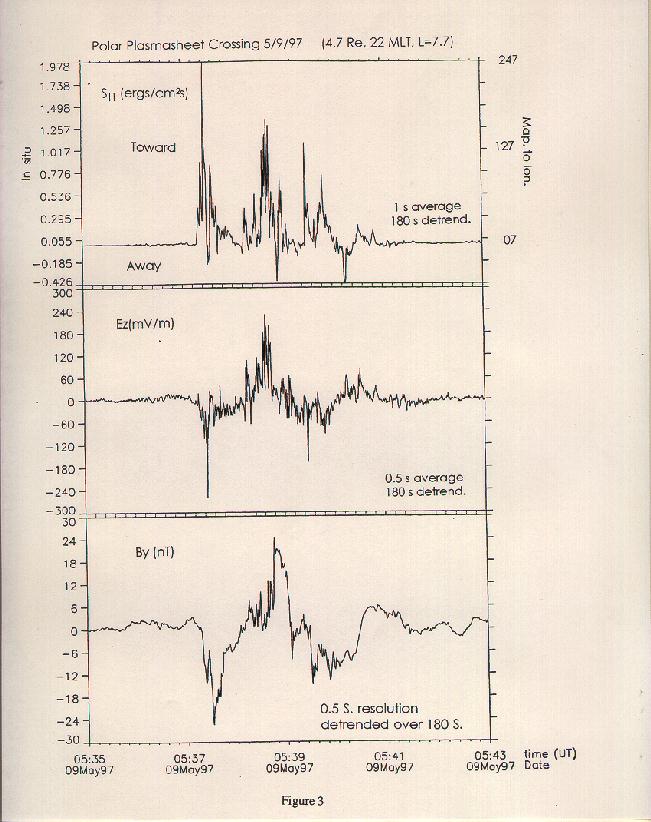
Figure 3 Expanded view of the Poynting flux, Ez, and By from May 9, 1998 during time of large electric fields.
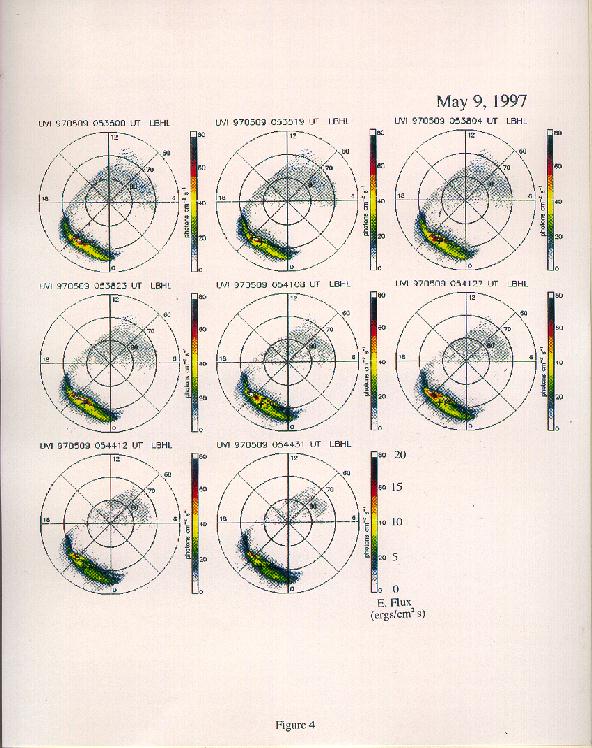
Figure 4. Images of the aurora from the UVI instrument on the POLAR spacecraft on 5/9/1997. The LBH-long filter used in this image provides an indicator of the total energy deposited in the ionosphere by auroral electrons. The track of the spacecraft is indicated by the small cross (+).
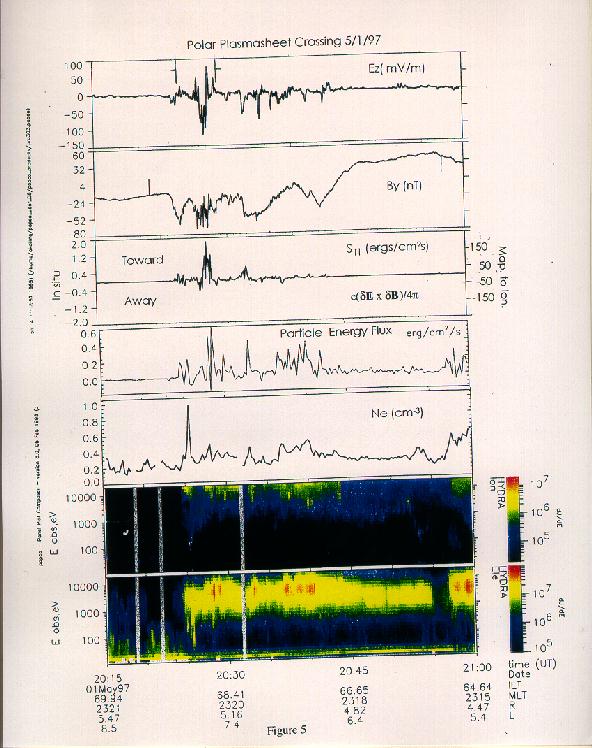
Figure 5. Data for the lobe-PSBL crossing on 5/1/1997. The panels are in the same format as in Figure 1.
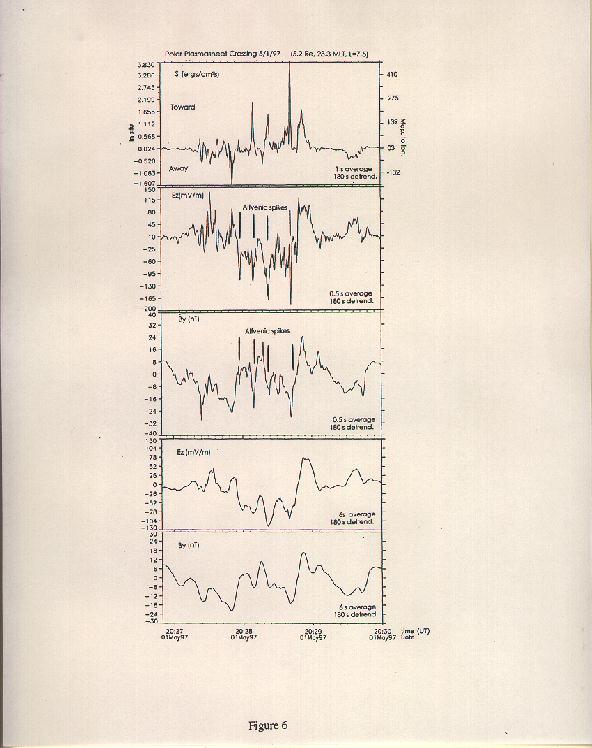
Figure 6. A expanded of the event shown in Figure 3.
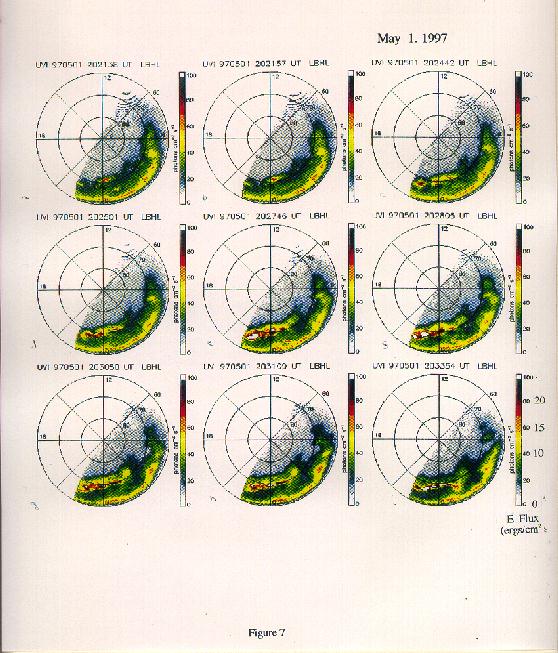
Figure 7. Images of the aurora from the UVI instrument on the POLAR spacecraft on 5/1/1997. The LBH-Long filter used in this image provides an indicator of the total energy deposited in the ionosphere by auroral electrons. The track of the spacecraft is indicated by the small cross (+).