|
[an error occurred while processing this directive]
#3a. Auroral Frequency Map by Elias Loomis
|
(Files in red–history)
|
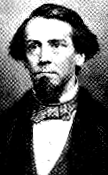
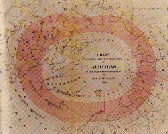
 Elias Loomis Below is map of the frequency with which aurora is seen in various polar regions, produced in 1860 by Elias Loomis (1811-1889), professor of natural philosophy at Yale. The central band has at least "80 auroras annually".
One might expect the center of the pattern to be at the magnetic pole, but it is not: the magnetic pole is in northern Canada, while the center of the pattern is near the northwestern end of Greenland. The reason is that the Earth's field is not exactly like that of a bar magnet, but contains additional irregularities, more complex and effective mainly near the surface, not far out in space. Click here for a full size version (144 K) of this image.
|
|
Timeline Expanded timeline Glossary Author and Curator: Dr. David P. Stern
|

